Running redundant AdGuard@Home DNS servers on Synology

This is a quick post on how to run multiple instances of AdGuard@Home on a single Synology host using Docker.

Problem: you cannot easily, using Docker, run multiple instances of the same program - or different program - while listening on the same port.

Solution: do not use host or bridge networking, but put the container on the same network as the host using macvlan.

To achieve this, we need to do the following:

Prerequisites

  1. Find the name of the network interface your Synology is using to connect to the network you want your Docker containers to be running on. This can be for instance eth0 for a single interface, or bond0 for when you use channel bonding. You can find this under Control Panel > Network > Network interface. In my case, this is bond0 which is what I will use in the examples below.

Configuring the interface

Now we have to configure the interface Docker can use. We do this by adding a bridge on top of the existing physical interface you use on your network.

  1. ip link add macvlan-br0 link bond0 type macvlan mode bridge
    This adds a bridge device on top of the physical interface with the name macvlan-br0
  2. ip addr add 192.168.0.254/32 dev macvlan-br0
    This adds an IP address on the bridge device so the host has an IP address in the range will give to Docker
  3. ip link set macvlan-br0 up
    This will activate the virtual bridge device
  4. ip route add 192.168.0.192/26 dev macvlan-br0
    This will add a route to the Docker network so it can be reached

You will have to put this in a script you can run at boot of your Synology device, as these settings will not retain over a reboot as we have to make them on the commandline and cannot make them in the Synology DSM.

#!/bin/bash
#
# Set timeout to wait host network is up and running
sleep 60
#
# Recreate the host macvlan bridge
ip link add macvlan-br0 link bond0 type macvlan mode bridge
ip addr add 192.168.0.254/32 dev macvlan-br0
ip link set macvlan-br0 up
ip route add 192.168.0.192/26 dev macvlan-br0

Docker

Now that we have set up the host, we can continue creating a new network in Docker that can be used by our containers. To do this, type:

docker network create -d macvlan \
  --subnet=192.168.0.0/24 \
  --gateway=192.168.0.1 \
  --ip-range=192.168.0.192/26 \
  --aux-address 'host=192.168.0.50' \
  -o parent=bond0 macvlan-br0

This will create a network in Docker on the subnet of your network in a dedicated range of IP addresses using your physical interface and virtual bridge device.

Do make sure the IP range you specify for Docker is not part of your DHCP scope, if you are also running DHCP or you will get IP conflicts. Docker does not use DHCP, and instead will just hand out IP addresses from this range in order to each container.

Now you can create your Docker containers as usual and configure them to use this network, instead of the standard host or bridge networks Docker uses by default. You can also assign this network to existing containers if you want.

Install container

To install AdGuard@Home on your Synology, open Docker, go to “Registry” and search for “adguard”

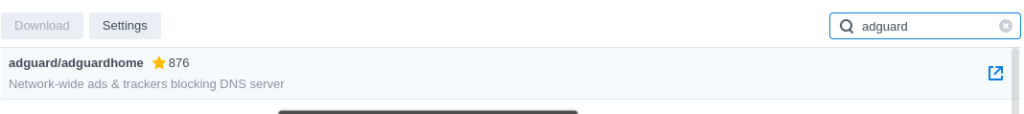
Double click to download the latest version.

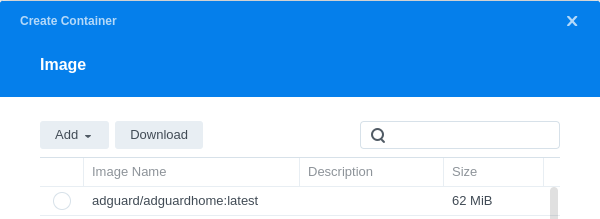
When it is done downloading, you can go to the “Container” section, and hit create. A window will popup where you can select your freshly downloaded image.

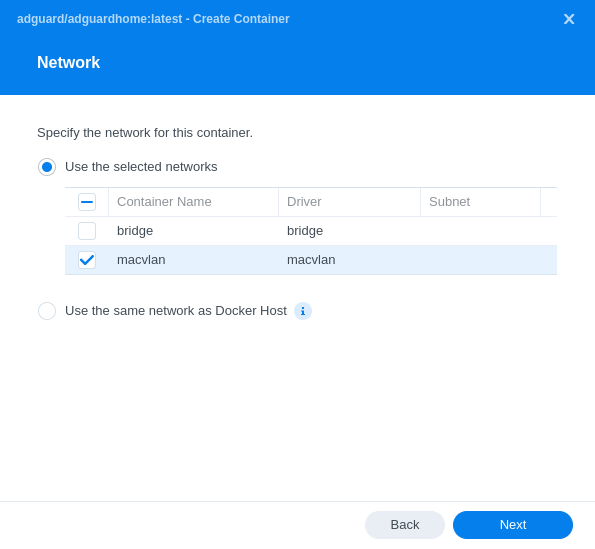
Select it and click next to follow the instructions. Configure what you want, but make sure to select the macvlan network when you get to the screen to pick the network.

Congratulations! Test your new container that is now present on your local network.

Important note: if you are running the DNS server on your Synology for your local network, and you want to keep using that, make sure you configure your AdGuard as DNS for your clients, and add the following to your AdGuard DNS configuration under upstream servers:

[/domain.local/]192.168.0.254:53

This will instruct AdGuard to use the IP address you added to your bridge device at the beginning as the source for resolving domain.local hosts. 

The complete upstream section for me looks something like (I use Cloudfare DNS for internet, and Synology DNS for local addresses):
tls://1.1.1.1
tls://1.0.0.1
[/domain.local/]192.168.0.254:53

Do not use the real IP address of your Synology host; this is not reachable for Docker and will not work! Use the bridge device address instead.

Monitoring your network or homelab using Zabbix and Grafana

For the longest time, I have been monitoring my network and homelab using Observium. This worked and does work very well. Observium is very good at what it does. However, there are a couple of things that do not work so well for me using Observium:

  • Observium does not let me add applications to monitor very easily or at all
  • Observium is limited to what can be offered through SNMP
  • Observium is not open source and as such it cannot be modified or changed to your needs
  • Observium is not an application I have come across in my professional life, so knowing how it works does not help me professionally.

That last bit is obviously not a necessity, however I do feel it’s always a nice thing to be able to apply things you have learned in your homelab into your professional environment.

After lots of investigations and trial & error, I have settled on using Zabbix for my monitoring needs. Zabbix is open source product that is used a lot in corporate environments and it is very flexible and extensible. Obviously you could add or change code as it is open source, but you don’t really need to. As Zabbix is template driven, its functionality can be extended by adding templates and there is a plethora of templates available for Zabbix, both on the Zabbix site itself (Zabbix Share) as well as places like GitHub. Also, Zabbix can use an agent installed on the system to collect the data you want to monitor, or you can use SNMP if you can’t or don’t want to install an agent on a device (for instance a network router).

The one thing I do not like about Zabbix is that the historic view is not easy to get to, nor as pretty displayed in a dashboard-like view as it is in Observium. However, that is not a blocker as we can use Grafana, another open source tool that is used quite a bit in Corporate Land to create dashboards and display relevant historic data.

Installing Zabbix

Installing Zabbix is no more complicated than installing most other software on Linux. I installed Zabbix on my Raspberry Pi 2B and the short version is this:

a. Install the Zabbix repository:
# wget https://repo.zabbix.com/zabbix/5.4/raspbian/pool/main/z/zabbix-release/zabbix-release_5.4-1+debian10_all.deb
# dpkg -i zabbix-release_5.4-1+debian10_all.deb
# apt update

b. Install the Zabbix server, frontend and agent on the server machine
# apt install zabbix-server-mysql zabbix-frontend-php zabbix-apache-conf zabbix-sql-scripts zabbix-agent

c. Create the database for Zabbix
# mysql -uroot -p
password
mysql> create database zabbix character set utf8 collate utf8_bin;
mysql> create user zabbix@localhost identified by 'password';
mysql> grant all privileges on zabbix.* to zabbix@localhost;
mysql> quit;

And import the database schema
# zcat /usr/share/doc/zabbix-sql-scripts/mysql/create.sql.gz | mysql -uzabbix -p zabbix
If your database is not residing on your Zabbix server, you can add -h <server> to the above to make sure you are connecting to the remote database server. Also, when creating the user and you are using a remote database, make sure the Zabbix user is allowed to connect over the network to the database.

d. Configure the Zabbix server to use the database you have created by filling out the relevant fields in /etc/zabbix/zabbix_server.conf

e. Start your brand-new Zabbix server:
# systemctl restart zabbix-server zabbix-agent apache2
# systemctl enable zabbix-server zabbix-agent apache2

f. You are done. You can now login to your server on http://<server>:3000 and log in with user Admin and password zabbix and configure everything else using the web frontend.

Installing Grafana

Installing Grafana is equally simple.
a. Install the pre-requisites and add the repository key
sudo apt-get install -y apt-transport-https
sudo apt-get install -y software-properties-common wget
wget -q -O - https://packages.grafana.com/gpg.key | sudo apt-key add -

b. Add the repository
echo "deb https://packages.grafana.com/oss/deb stable main" | sudo tee -a /etc/apt/sources.list.d/grafana.list

c. Install Grafana
apt update
apt install grafana

d. Then it is just a matter of starting the Grafana server and making sure it starts at boot.
systemctl daemon-reload
systemctl start grafana-server
systemctl status grafana-server
systemctl enable grafan-server

That’s it! You can now log in using the default username/password of admin/admin.

Note: if you want to apply specific configurations, like for instance database (mysql, postgres, sqlite3) beyond the default, you should refer the Grafana manuals as that would be a bit beyond the scope of this page.

Tying things together…

First you will need to install the Zabbix app into Grafana. We can do this using the commandline interface for Grafana:

grafana-cli plugins install alexanderzobnin-zabbix-app

After you do this, you can configure the Zabbix datasource. Go to Configuration -> Data sources and click “add data source”. Scroll down to the bottom, and you will see one called ‘Zabbix’.

Fill in the details of your Zabbix installation, and make sure you add the api_jsonrpc.php to the end of your URL. Check ‘With credentials’ under auth and under Zabbix API details add your username and password. Click “Save & test” and if all is ok, it will give you a green checkmark while saying data source updated.

You are now ready to add a dashboard to your Grafana and start monitoring your Zabbix data. I use this dashboard from Paulo Paim. You can add it by going to Dashboards -> Manage and then clicking the import button. In the box saying import from grafana.com, type the ID of the dashboard. In this case 5363 and click load.

That’s it!

Links:
Zabbix manual
Grafana documentation
Zabbix templates and add-ons
Grafana dashboards and plugins